Watching the Wrong Walls: Why Legacy Monitoring Tools Cannot See the Architectures That Now Power American Enterprise
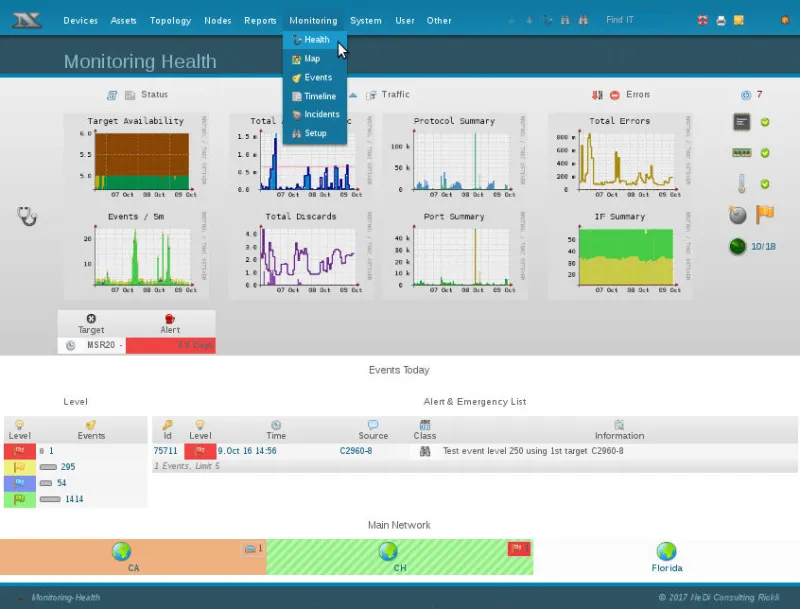
Photo: Ricklir, CC BY-SA 4.0, via Wikimedia Commons
For decades, enterprise monitoring operated on a deceptively simple premise: watch the servers, watch the databases, watch the network links. If those components stayed green, the application stayed healthy. That logic held when applications were monolithic structures running on predictable hardware inside well-defined data centers. It does not hold today — and the gap between what legacy monitoring tools can observe and what modern distributed systems actually do has become one of the most consequential blind spots in American enterprise technology.
The problem is not that legacy monitoring tools are poorly built. Many of them were exemplary engineering achievements for their era. The problem is that they were designed around architectural assumptions that cloud-native deployments systematically violate. Polling intervals measured in minutes, host-centric metric collection, static threshold alerting, and topology maps drawn by hand — these design choices were sensible in 2005. In 2025, they are instruments of false confidence.
A Fundamental Architectural Mismatch
Monolithic applications had a defining characteristic that made traditional monitoring tractable: they were bounded. A failure in a monolith was, almost by definition, a failure you could locate. The application either responded or it did not. The process was running or it was not. CPU utilization climbed on a specific host, and an alert fired. The remediation path, however painful, was at least navigable.
Modern distributed architectures dissolve those boundaries entirely. A single customer transaction in a contemporary cloud-native application may traverse dozens of microservices, invoke multiple serverless functions, consume managed cloud services from two or three providers, and touch data stores spread across availability zones. No single host owns that transaction. No single metric captures its health. The failure modes are not binary — they are probabilistic, partial, and frequently invisible to any tool that monitors components rather than flows.
Serverless workloads compound the problem further. Functions that execute in milliseconds, spin up on demand, and vanish after invocation leave almost no footprint for polling-based collectors to capture. A function that fails four thousand times in a single hour may never appear in a legacy monitoring dashboard because it never persisted long enough to register as a host. The failure happened. Customers experienced it. The monitoring system reported nothing unusual.
The Incident That Reveals the Gap
The pattern is consistent enough across enterprises that it has become almost formulaic. An organization migrates a significant portion of its workload to a microservices architecture, retaining its existing monitoring stack because the migration roadmap treats observability as a later concern. The dashboards continue to show familiar metrics. Engineers gain confidence. Then an incident occurs — not a dramatic outage, but a slow degradation: checkout flows timing out for a subset of users, API responses becoming erratic at specific traffic volumes, a downstream service silently dropping requests under load.
The monitoring system does not fire. The thresholds set for the old architecture do not apply to the new one. By the time the engineering team learns about the problem, it has arrived through a customer support ticket, a social media complaint, or a business stakeholder noticing a revenue anomaly. The post-mortem reveals that the failure was detectable — in principle. The signals existed in logs, in trace data, in latency distributions. But no tool was positioned to correlate them, and no alert was configured to surface them.
This scenario has played out at financial services firms in New York, logistics platforms in Chicago, healthcare technology companies in Boston, and retail operations across the Sun Belt. The geography varies. The architectural mismatch does not.
What Legacy Tools Cannot Reconstruct
The core limitation of traditional monitoring in distributed environments comes down to three interlocking deficiencies.
Topology blindness. Legacy tools model infrastructure as a static inventory. Distributed systems are dynamic topologies where service relationships change with every deployment and where ephemeral compute resources appear and disappear continuously. A monitoring system that cannot discover and map service dependencies in real time cannot reason about cascading failures — which are the predominant failure mode in microservices environments.
Metric granularity and cardinality. Traditional monitoring was designed for low-cardinality metric spaces: a handful of hosts, a few dozen metrics per host, alert thresholds set by hand. Modern distributed systems generate metric streams with cardinality in the millions — every unique combination of service, endpoint, region, deployment version, and customer segment potentially represents a distinct signal. Legacy collectors were not built to ingest, store, or query at that scale without degrading into uselessness.
Trace context absence. Perhaps the most consequential gap is the absence of distributed tracing. Understanding why a transaction failed in a microservices environment requires the ability to follow a request across every service boundary it crossed and every resource it touched. Legacy monitoring tools have no concept of trace context. They observe components; they cannot reconstruct journeys. Without that capability, root cause analysis in distributed systems becomes an exercise in educated guessing.
The Cost of Delayed Recognition
Enterprises that have undergone the painful process of discovering these blind spots after an incident tend to describe the experience in similar terms: the monitoring infrastructure they trusted had become a theater of confidence rather than an instrument of genuine visibility. The dashboards were populated. The alerts were configured. The on-call rotations were staffed. And none of it was watching the right things.
The financial cost of that gap is difficult to generalize, but industry research consistently places the average cost of a significant application outage for a large US enterprise in the range of hundreds of thousands of dollars per hour — a figure that does not capture the longer-term costs of customer attrition, regulatory scrutiny in sensitive sectors, or the engineering hours consumed by post-incident investigation without adequate tooling to guide the analysis.
Rearchitecting Visibility for the Systems That Actually Exist
The organizations that have successfully closed this gap share a common recognition: observability for distributed systems is not an upgrade to existing monitoring — it is a different discipline with different primitives. The shift from metrics-only monitoring to the coordinated collection of metrics, logs, and distributed traces represents a genuine architectural transition, not a tooling swap.
The most effective enterprise approaches treat this transition as a first-class engineering investment. Instrumentation standards are established at the platform level, not left to individual service teams. Trace propagation is enforced through shared libraries and service mesh policies. Alerting logic is rebuilt around service-level objectives and error budget consumption rather than fixed thresholds on individual metrics. And critically, the observability platform is evaluated against the actual topology of the production environment — not the topology that existed when the monitoring stack was originally procured.
For American enterprises operating at scale, the underlying message is uncomfortable but clear: the monitoring infrastructure that provided adequate coverage for the previous generation of architecture is not simply underperforming against modern workloads. In many cases, it is actively misleading — providing the appearance of visibility while leaving the most consequential failure modes entirely unobserved. Closing that gap is not optional. It is a prerequisite for operating distributed systems with any meaningful degree of confidence.